Facebook Users Statistics and Trends:
How Many People Use Facebook in 2024?
-
by Hemant Sharma
- . Updated April 26, 2024
One of the first and biggest social networking sites is Facebook, which dominates almost all statistical benchmarks.
Since Facebook was founded in 2004 by Mark Zuckerberg and two of his Harvard roommates, it has grown into a multi-billion-dollar platform that attracts millions of daily users.
Looking at Facebook’s growth year-over-year makes it super important for marketers.
However, as the audience grows, so does the competition to reach them. Because of this, it’s more crucial than ever to comprehend the constantly changing platform in 2022.
Without any further ado, let’s look at the latest statistical data on how huge the most famous social network really is.
- Facebook’s ‘family’ and Facebook platform user count
- The number of Facebook platform user accounts
- Facebook Family product metrics
- Facebook user growth rate
- How many Facebook accounts are fake?
- Facebook users by countries
- Most widely used social media platforms globally
- Statistics on Facebook Mobile vs Desktop usage
- Facebook users demographics
- Average daily time spent on Facebook
- What times of day see the most traffic on Facebook?
- Popular Facebook Ads Stats
- How many employees does Facebook have?
The most impressive Facebook statistics and trends from this roundup are as follows:
Essential Facebook Statistics and Trends
- DAUs – Facebook daily active users: At present, 2.09 billion daily active users access Facebook, an increase of 5% year-over-year
- MAUs – Facebook monthly active users: At present, 2.96 billion monthly active users access Facebook, an increase of 2% year-over-year
- In the first quarter of 2022, Facebook removed 1.6 billion fake accounts, down from 1.7 billion in the previous quarter
- India has the most Facebook users with over 340 million, followed by US (180 million), Indonesia (130 million), Brazil (114 million), and Mexico (92 million)
- Facebook is the largest social media platform worldwide at 2.96 billion monthly active users globally, followed by YouTube (2.3 billion), and WhatsApp (2 billion), Instagram(1.3 billion), Facebook Messenger (988 million), and WeChat (1.2 billion)
- Highest traffic day and time on Facebook is Wednesday at 9 am and 1 pm. The most engagement will result from posting at this time
- Facebook is responsible for 23% of all internet traffic
- 58.25% of the world’s active internet users access Facebook every month, and 73.13% access family owned services such as FB, Messenger, Instagram, and WhatsApp
- DAPs – Facebook Family daily active people: At present, 2.93 billion daily active people access Facebook-owned services (FB, Messenger, WhatsApp, and Instagram), an increase 4% year-over-year
- MAPs – Facebook Family monthly active people: At present, 3.71 billion monthly active people access Facebook-owned services (FB, Messenger, WhatsApp, and Instagram), an increase 4% year-over-year
- Facebook ‘family’ monthly active people are more than population of India and China combined
- The number of people using Facebook’s family products is equal to the populations of Africa, Europe, North America, and South America taken together today
- Facebook ads reach is 2.14 billion people on earth
- Facebook currently has 87,314 fulltime employees, an increase of 28% year-over-year
Facebook’s Family & Platform User Count
Facebook releases it’s investor’s reports every quarter – and according to that Facebook breaks down it’s users in two categories:
1. Facebook daily/monthly active users: The number of daily/monthly active users on Facebook’s website and app together.
2. Family daily/monthly active users: The number of daily/monthly active users on Facebook ‘family’ owned platforms – Facebook, Messenger, WhatsApp, and Instagram.
Let’s start with Facebook as a platform only first:
The Number of Facebook Platform User Accounts
Based on the Facebook’s investors reports – we’ll look at the current Facebook users on daily and monthly active accounts accessed via website/mobile app.
Sidenote: this doesn’t include ‘family’ products data like Messenger, WhatsApp, and Instagram.
How Many People Use Facebook In 2022
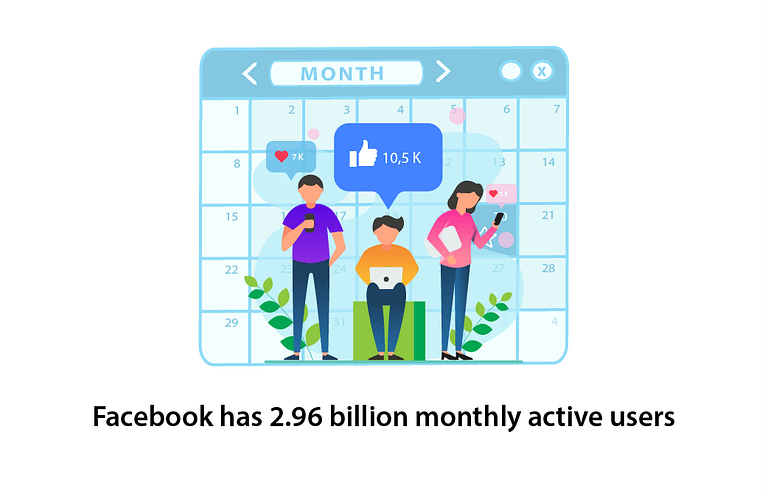
According to Facebook Q3 2022 investor’s report, Facebook currently has 2.96 billion monthly active users (MAUs).
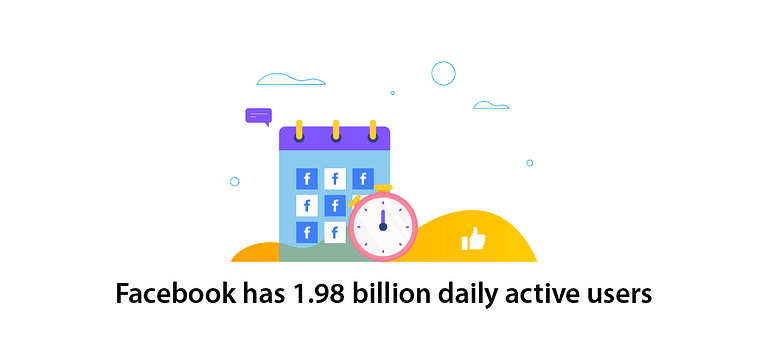
Furthermore, Facebook current daily active users stands at 1.98 billion (DAUs). That means 67.2% of monthly active users log in to Facebook via website or mobile app.
Now let’s understand current daily and monthly users stats in little more depth:
Number of Facebook Monthly Active Users (MAUs)
Meta, formerly Facebook, defines monthly active user (MAUs) as a registered and logged-in user who has interacted with Facebook through the company’s website or mobile app in the last 30 days as of the date of measurement.
Essential Statistics and Trends:
- Facebook currently has 2.96 billion monthly active users (MAUs)
- Q3 2022 investor’s report shows a 2% increase in MAUs year-over-year.
- 67.2% of monthly active users log in daily on mobile devices or desktop
- Roughly 36.72% of all the people on earth use Facebook every month
- Facebook drives 23% of all internet traffic
- 58.25% of the world’s active internet users access Facebook every month
- Placing the number of people who use Facebook on the continents would exceed the total population of Africa, Europe and North America combined
- 98.5% of Facebook users access it using their mobile devices
Sources: (Facebook) (Statista) (Worldometers) (Statista) (Statista) (World of Statistics)
Number of Facebook Daily Active Users (DAUs)
Facebook defines monthly active user (MAUs) as a registered and logged-in user who has interacted with Facebook through the company’s website or mobile app on any given day.
Essential Statistics and Trends:
- Facebook currently has 1.98 billion of daily active users on average (DAUs)
- Q3 2022 investor’s reports shows a 3% increase in DAUs year-over-year
- 67.2% of monthly active users log in daily on mobile devices or desktop
- 38.86% of the world’s active internet users access Facebook everyday
- 24.68% of the world’s population use Facebook daily
- 98.5% of user accounts access the Facebook platform using a mobile phone
Sources: (Statista) (Statista) (Worldometers) (Facebook) (Statista) (Statista)
Facebook Family Products Metrics
Now we will look into Facebook family owned products monthly and daily active users. Facebook family includes products such as:
- Messenger
This data includes both web browsers and mobile device applications users
How Many People Use Facebook's Family of Products?
According to the Q3 2022 investor report, globally Facebook family products have 3.71 billion monthly active people (MAPs). On-average, 2.93 billion are daily active people (DAPs) – that is 78.90% of monthly active people (MAPs).
Now lets look into the monthly and daily active people in a little more depth:
Facebook Family Product Monthly Active People (MAPs)
Facebook defines monthly active people (MAPs) as a registered and logged-in user of one or more of Facebook’s Family products who visited at least one of these products through a mobile device application or web browser in the last 30 days as of the date of measurement.
Essential Statistics and Trends:
- A total of 3.71 billion monthly active people (MAPs) access products owned by Facebook, including Instagram, WhatsApp, and Messenger
- Facebook, as a standalone platform, gets 2.96 billion monthly active users, of which may have accounts on other family products
- WhatsApp, as a standalone platform gets 2 billion monthly active users, of which may have accounts on other family products
- Instagram, as a standalone platform gets 1.38 billion monthly active users, of which may have accounts on other family products
- Messenger, as a standalone platform gets 988 million monthly active users, of which may have accounts on other family products
- Q3 2022 Facebook investor’s report shows a 4% increase in monthly active people year-over-year (MAPs)
- 78.97% of the monthly active people log in daily to one of these family-owned services
- 69.71% of the world’s active internet users access Facebook-owned services monthly
- 43.98% of world’s total population use Facebook-owned services monthly
- Facebook ‘family’ monthly active people are more than that live in India and China combined
- If we place the number of people using Facebook’s family of products on the continents, it would surpass the total population of Africa, Europe, and North and South America combined
Sources: (Facebook) (Statista) (IndianExpress) (Worldometers) (Statista) (Statista)
Facebook Family Product Daily Active People (DAPs)
Facebook defines daily active people (DAPs) as a registered and logged-in user of one or more of Facebook’s Family products who visited at least one of these products through a mobile device application or web browser on a given day.
Essential Statistics and Trends:
- A total of 2.93 billion daily active people (DAPs) access products owned by Facebook, including Instagram, WhatsApp, and, Messenger
- Facebook, as a standalone platform, gets 1.98 billion daily active users, of which may have accounts on other family products
- WhatsApp, as a standalone platform, gets 500 million daily active users, of which may have accounts on other family products
- Instagram, as a standalone platform, gets 500 million daily active users, of which may have accounts on other family products
- Q3 2022 Facebook Investor’s report shows a 3% increase in daily active people year-over-year
- 78.97% of the monthly active people log in daily to one of these family-owned services
- 58.25% of the world’s active internet users access Facebook-owned services daily
- 36.71% of the world’s total population access Facebook-owned services daily
Sources: (Facebook) (Statista) (Statista) (Worldometers)
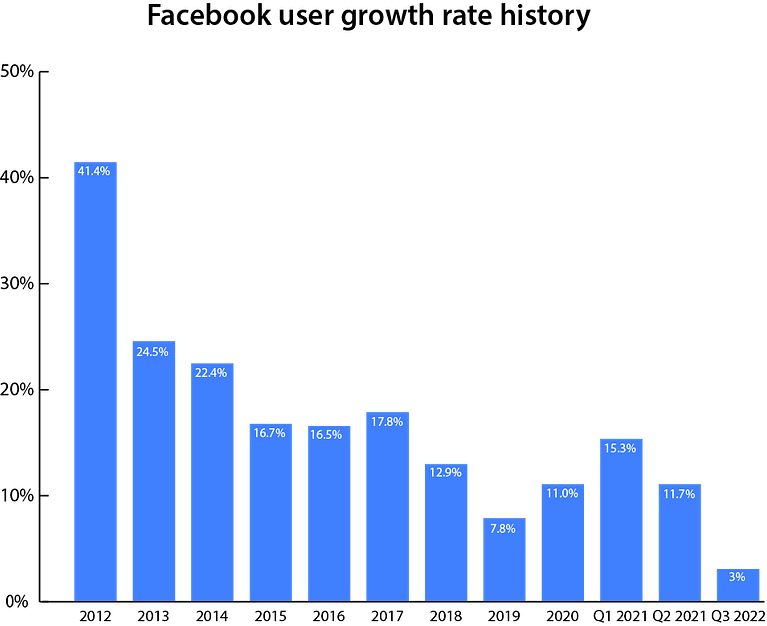
Facebook User Growth Rate
According to brandwatch, Facebook adds 5,00,000 new users every day; that comes to 6 new profiles every second.
In-addition to that, Facebook’s current daily user growth rate is 3% year-over-year, down from 6% in 2021.
History of Facebook daily active user growth rate year-over-year:
- Q3-2021 to Q3-2022: Facebook’s user growth rate (DAUs) was 3%
- Q2-2020 to Q2-2021: Facebook’s user growth rate (DAUs) was 11.7%
- Q1-2020 to Q1-2021: Facebook’s user growth rate (DAUs) was 15.3%
- Q1-2019 to Q1-2020: Facebook’s user growth rate (DAUs) was 11.0%
- Q1-2018 to Q1-2019: Facebook’s user growth rate (DAUs) was 7.8%
- Q1-2017 to Q1-2018: Facebook’s user growth rate (DAUs) was 12.9%
- Q1-2016 to Q1-2017: Facebook’s user growth rate (DAUs) was 17.8%
- Q1-2015 to Q1-2016: Facebook’s user growth rate (DAUs) was 16.5%
- Q1-2014 to Q1-2015: Facebook’s user growth rate (DAUs) was 16.7%
- Q1-2013 to Q1-2014: Facebook’s user growth rate (DAUs) was 22.4%
- Q1-2012 to Q1-2013: Facebook’s user growth rate (DAUs) was 24.5%
- Q1-2011 to Q1-2012: Facebook’s user growth rate (DAUs) was 41.4%
Sources: (Brandwatch) (Facebook) (Statista)
Facebook’s new user growth rate is definitely slowing down. But you can’t ignore its global size of more than half of world’s internet users. It’s also not shocking for a company with that size of userbase to gradually lose momentum.
According to Statista, there are 5.03 billion internet users in the world. And Facebook has 2.96 billion monthly active users and that’s without counting their family services like WhatsApp, Instagram, and Messenger.
But for Facebook most of the growth has come from Asia Pacific and other regions where company’s average revenue per user is only $4.05.
Had this growth come from US, Canada, and Europe then Facebook average revenue per user would be $61.99.
Source: (Statista)
How Many Facebook Accounts Are Fake?
In 2020, Facebook estimated that 5% of its profiles are fake, or 137 million accounts.
Essential Statistics and Trends:
- Facebook automatically blocks accounts before they get created, looking at IP addresses and signals of spammers
- The scanner scans for signs of harmful or hurtful behavior and blocks it as soon as they sign up
- Facebook reported that at one time, 5% of its 2.7 billion monthly active users had fake accounts
- According to the report, Facebook’s total number of fake accounts are 135 million
- It is not possible to compare false account data from two different time frames because the rules for defining false accounts are constantly changing.
Sources: (Statista) (Statista)
When it comes to advertising, Facebook sells us 2.9 billion monthly active users.
But the important question is how many of them are fake?
The vast majority of those fake accounts come from bots, or automated accounts that are often created in masses by software programs. The fake accounts also include duplicate accounts, spammers, scammers, and pages set-up as profiles.
At this scale, it’s difficult for Facebook to measure false accounts at any given time. This is the reason Facebook claim of 5% false accounts is questionable.
But the things that provide us trust in Facebook-
They use advanced detection systems that spot and block fake accounts during the registration process itself.
And Facebook’s advanced detection systems keep getting better.
Top Facebook Users By Country
The country that has the most Facebook users is India with close to 350 million active users, followed by the USA (200 million), Indonesia (140 million), Brazil (130 million), and Mexico (98 million).
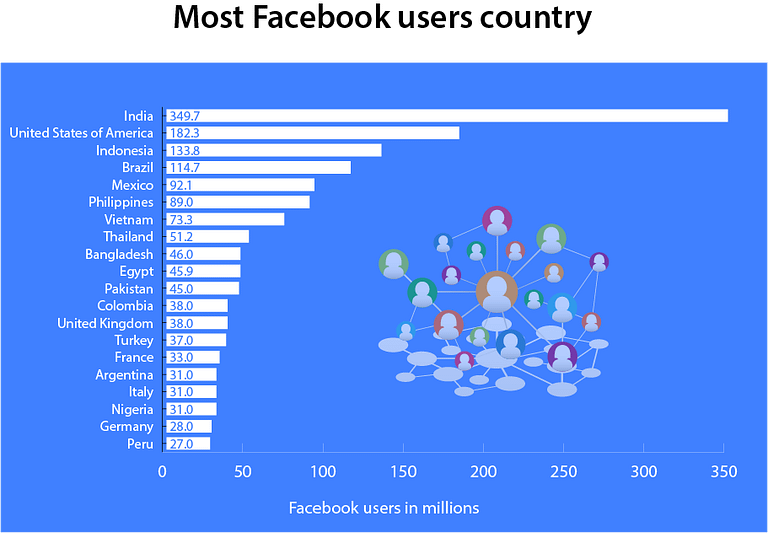
Here is the table that has full data:

Most Widely Used Social Media Platforms Globally
As of 2022, Facebook is the largest social media platform globally with 2.96 billion monthly active users worldwide.
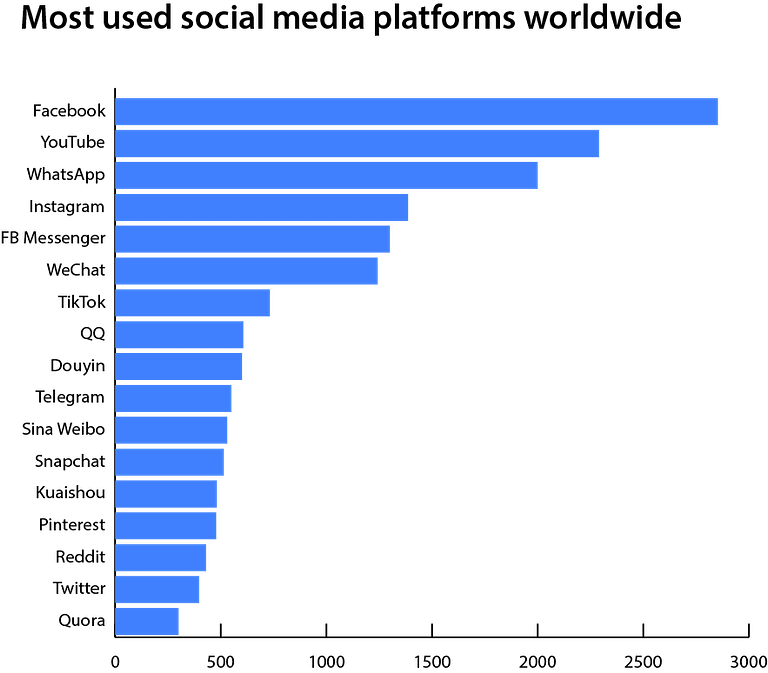
YouTube follows with 2.2 billion, along with WhatsApp, Instagram, Facebook Messenger and WeChat, all with more than a billion users.

Statistics on Facebook Mobile vs Desktop Usage
Facebook has 98.5% of its users accessing it with a mobile device. 81.8% of those users only use a mobile phone to access the social networking site Facebook.
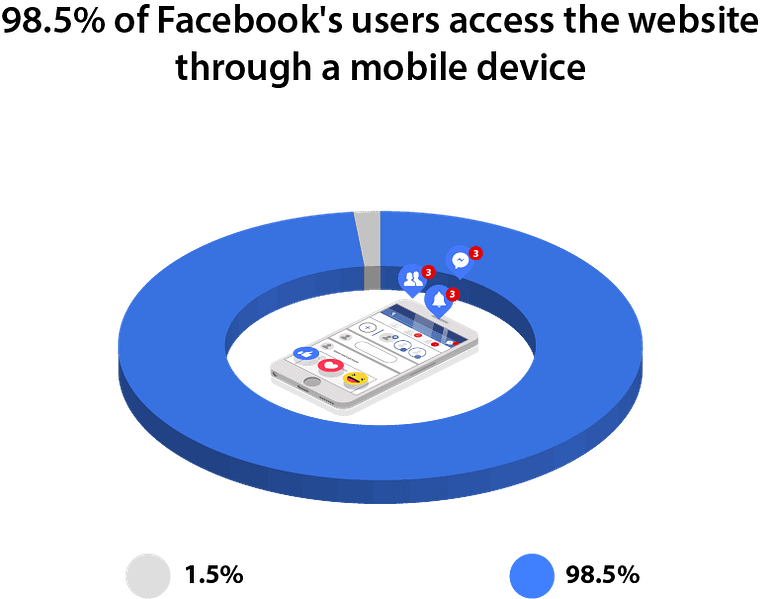
Users with both mobile phone and desktop are 16.7%. And just 1.5% out of them are desktop-only users.

Essential Statistics and Trends:
Out of its 2.96 billion monthly active users:
- 98.5% i.e. 2.91 billion access Facebook through mobile device like phones and tablets
- 81.8% i.e. 2.42 billion access Facebook through a mobile phone
- 16.7% i.e. 494 million access Facebook through both phones and desktops
- 1.5% i.e. 44 million access Facebook only through a laptop or desktop computer
As you can see, Facebook clearly wins on mobile.
Facebook generates 94% of its ad revenue from mobile devices, leaving only 6% from desktop.
This is Facebook’s own ad revenue, thus it has nothing to do with your conversions. Therefore, Facebook’s desktop advertisements may be a better fit for your campaign.
Facebook Users Demographics
57% of Facebook users are male, compared to a 43% Female user base worldwide. In the United States, however, 78% of females use Facebook, compared to 66% of men.
In addition, men make up 72.5% of Facebook users in India, the nation with the most active user base.
Many younger generations have grown up using Facebook since the site’s launch in 2004. The user base changes as the social network evolves with new tools, algorithms, and trends.
Here, we look at the present demographics of the world’s largest social media site.
Facebook Age and Gender Demographics:
Globally, 43.5% of women and 56.5% of men respectively use Facebook on desktop or mobile devices, making men the platform’s most frequent users.
Millennials (a person born between the early 1980s and the late 1990s) are the most popular age group among
Facebook users on average:
- 31% of people aged 25-34
- 22.6% of people aged 18-24
- 17.9% of people aged 34-44
- 11% of people aged 45-54
- 6.8% of people aged 55-64
- 5.6% of people aged 13-17
- 5.3% of people aged 65+
Facebook Education Demographics:
As of February 2021, according to available data in the United States:
- 64% of people educated at high school or less
- 76% of people educated at college level
- 77% of people educated at more than college level
Facebook Income Demographics:
As of February 2021, according to available data in the United States:
- 69% of people earning less then $30,000
- 76% of people earning $30,000-$49,999
- 65% of people earning $50,000-$74,999
- 78% of people earning more than $75,000
Sources: (Statista) (Napoleoncat) (Pew Research Center)
Average Daily Time Spent on Facebook
In 2021, Americans aged 18 and older spent 33 minutes on average per day on Facebook, according to an eMarketer report. From the 39 minutes in 2017, this is a 6 minute decrease.
TikTok and Twitter are the next most popular apps, with daily average usage of 31 minutes each.
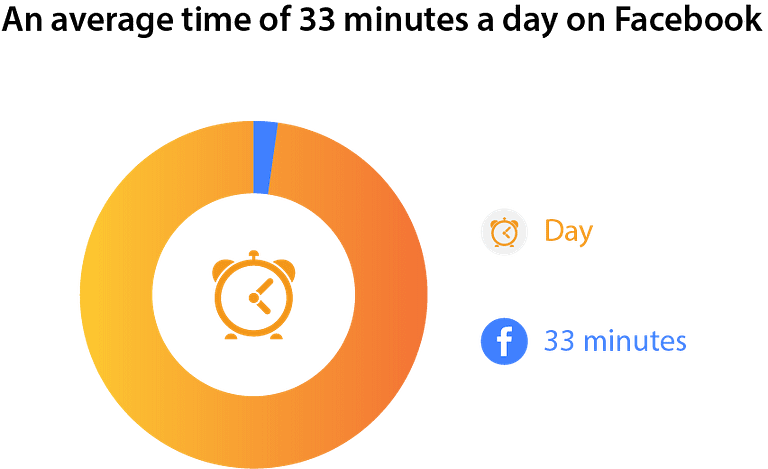
Essential Statistics and Trends:
- The average amount of time spent on Facebook every day is 33 minutes
- According to this research, the average Facebook user over the age of 18 will spend more than 9 days each year on the platform
- In comparison, the average user spends 1 hour and 20 minutes every day on social media
- According to this research, the average person over the age of 18 will spend more than 19 days per year on social media across all platforms
Source: (eMarketer)
So, why is the average daily time spent on Facebook decreasing?
Facebook has been encouraging its users to interact with more “meaningful” content, which means less postings from media outlets, corporations, and businesses in favour of letting users see more updates from friends, family, and groups. Facebook predicted that this decision would have a negative effect on how much time users spent on the site, and it did.
But by taking this step, the user’s perception of the platform as a whole is somewhat balanced.
Additionally, as young people shift their attention and time to other social media platforms like TikTok and Twitter, Facebook has continued to lose young users.
However, Facebook continues to dominate social media usage despite these developments.
What Times of Day See The Most Traffic On Facebook?
According to the statistics, Facebook gets the most traffic on weekdays between 9 am and 3 pm. This is the time when posts can get the highest engagement. If looking for a specific day and time – then the best day to target posts is Wednesday because it has the highest traffic between 11 am and 1 pm.
Essential Statistics and Trends:
- Best times to post on Facebook: Monday to Friday between 10 am to 1 pm
- Best day to post on Facebook: Wednesday between 9 am and 1 pm
- Worst days to post on Facebook: Saturday and Sunday after 8 pm or 5 am as these times have the least engagement
- Worst times of the day to post on Facebook: Early mornings and late evenings, before 5 am and after 9 pm have the least amount of engagement per day
Source: (Sproutsocial)

In 2019, Facebook updated its algorithm once more to prioritise friends, family, and groups over brands and make the news feed display more “meaningful interactions.”
In other words, now Facebook is encouraging people to people posts than brand to people posts.
Given these limitations, it’s more crucial than ever for brands to post at the ideal time to maximize organic exposure.
In fact, I’ve written a comprehensive post that details how to increase Facebook’s organic reach.
Popular Facebook Ads Statistics
Facebook estimates its ads can reach 2.14 billion people or 72.5% of total 2.96 billion monthly active users. That covers 34.1% of the population over age 13 on earth.

Essential Statistics and Trends:
- Reaching 2.14 billion people is possible through Facebook ads
- According to eMarketer, US ad revenue will reach $58.1 billion in2022, an increase of 15.5% from 2021
- In general, Facebook ad costs are lower in the first quarter of every year and peak just before the last quarter or the holiday shopping season
- 34.1% of people globally who are over 13 see Facebook ads
- Facebook advertising reach 63.7% of adults in the United States
- A WordStream study found that for Facebook ads, the average click-through rate is 0.90% across all industries
- The average cost-per-click on Facebook is $1.86
- The average cost per thousand views on Facebook is $11.20 as of Quarter 2, 2020
- It is also found that the average conversion rate is 9.21% and the average cost-per-action is $18.68 on Facebook ads
Sources: (Hootsuite) (HubSpot) (WordStream) (Facebook)
How Many Employees Does Facebook Have?
According to Q32022 investor’s report, Facebook has 87,314 fulltime employees. That’s a 28% increase year-over-year.

What an increase from Mark Zuckerberg’s dorm room at Harvard in 2003. With that, here is a table that shows the full data:

Takeaway
That’s all for my Facebook’s users statistics.
Knowing that more than half of the world’s active internet users uses Facebook surprised me.
What surprised you the most?
What other information should this roundup include, in your opinion?
I’d be glad to hear it – leave a comment below.
11 Responses
Essential Facebook users data. I love the presentation, it’s so easy to grasp.
Thanks Naveen. Happy to see you like it!
Surprising Facebook facts. Shocked to know that so many people use Facebook in 2023
Yes, numbers can always surprise you!
I questioned Facebook’s widespread use. But when you look at the stats, you can see that as 2023 approaches, Facebook is still highly popular.
I can’t agree more with you!
Essential Facebook users data. I love the presentation, it’s so easy to grasp.
Thanks Prakhar 🙂
FACEBOOK MONTHLY ACTIVE USERS 4.8 BILLION AND 35 MILLIONS ON SPOTIFY ALONE NETFLIX.TIKTOK.AMAZON AND YAHOO ETC
Thanks for sharing your knowledge. To gain a more in-depth understanding, click here for further insights.
Glad you liked it!